We all know big data drives profit – when it can be interpreted correctly that is. So, finding the right tools to make sense of meaningless data is the first step to profit in this case. That’s why we are highlighting DAX in this blog. We want you to see Data Analysis Expressions (DAX) not just as a tool but as the key to unlocking a world filled with data-driven opportunities. So, in this blog we’re laying the foundation for DAX in Power BI. We’ll cover the basics, and the differences to common questions. By the end, you’ll see why it is an indispensable tool that empowers you to create powerful Power BI reports and conduct insightful analyses.
What Is DAX?
DAX, short for Data Analysis Expressions, supercharges Power BI. Think of it as a dynamic data interaction language, like Excel formulas on steroids. It’s more than a language; it’s a versatile tool for real-time data manipulation. With DAX, you create responsive calculated columns, measures, and tables, taking your Power BI from static reports to dynamic analytics.
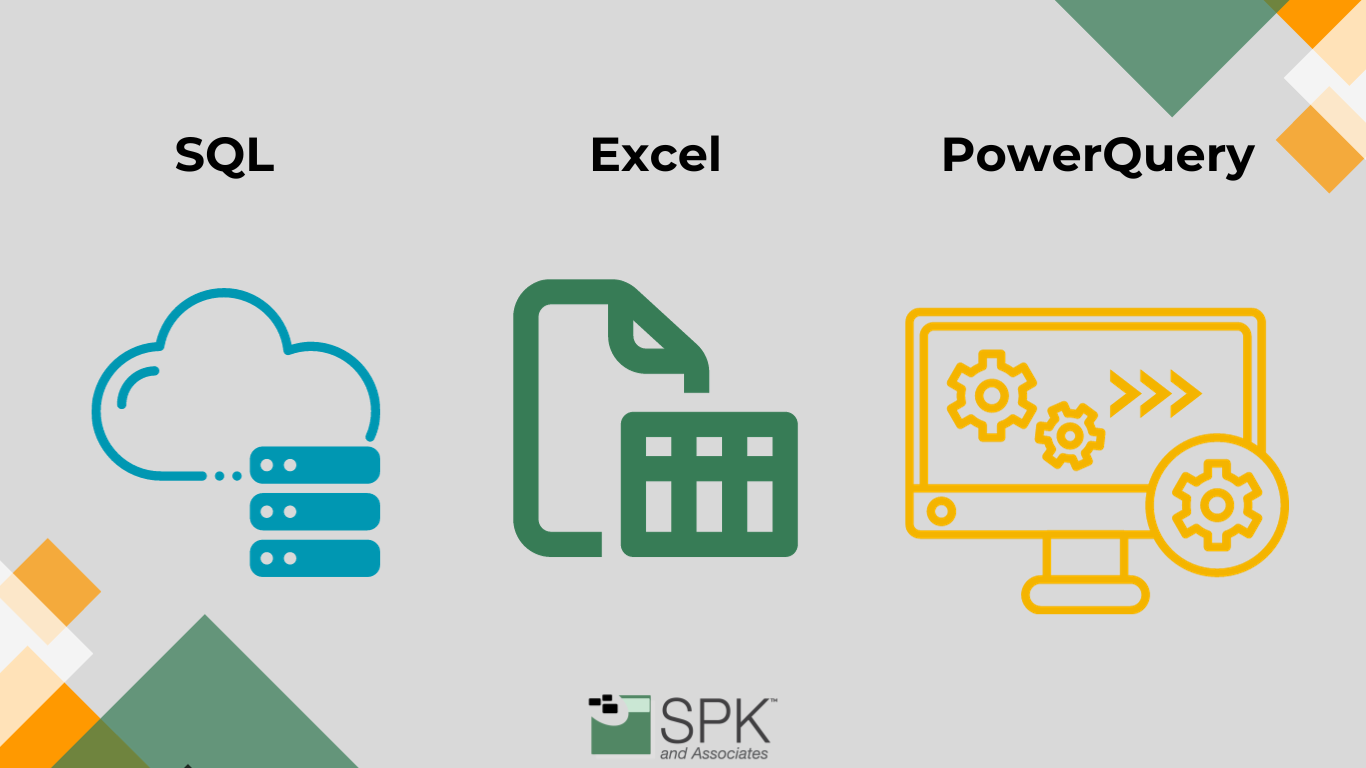
Comparing DAX to SQL, Excel, and PowerQuery
So, is DAX the same as SQL, Excel and PowerQuery?
- SQL: SQL is a query language designed for managing and querying databases. Conversely, DAX, is all about calculations and analytics within Power BI’s data model.
- Excel: While Excel is a versatile spreadsheet tool, DAX takes it a step further by providing dynamic and interactive data analysis within Power BI.
- PowerQuery: PowerQuery is primarily used for data transformation tasks. For example, data cleaning and shaping. On the other hand, DAX, specializes in data modeling and analysis.
Another common query: Is DAX the same as M Language (or M Code)?
DAX excels at calculations and dynamic reports. It’s the go-to for creating responsive dashboards, calculated columns, and real-time measures. Comparatively, M Language is the scripting language behind Power Query. M Language is your data powerhouse for shaping, cleaning, and merging data from diverse sources before it enters your model.
Key Traits:
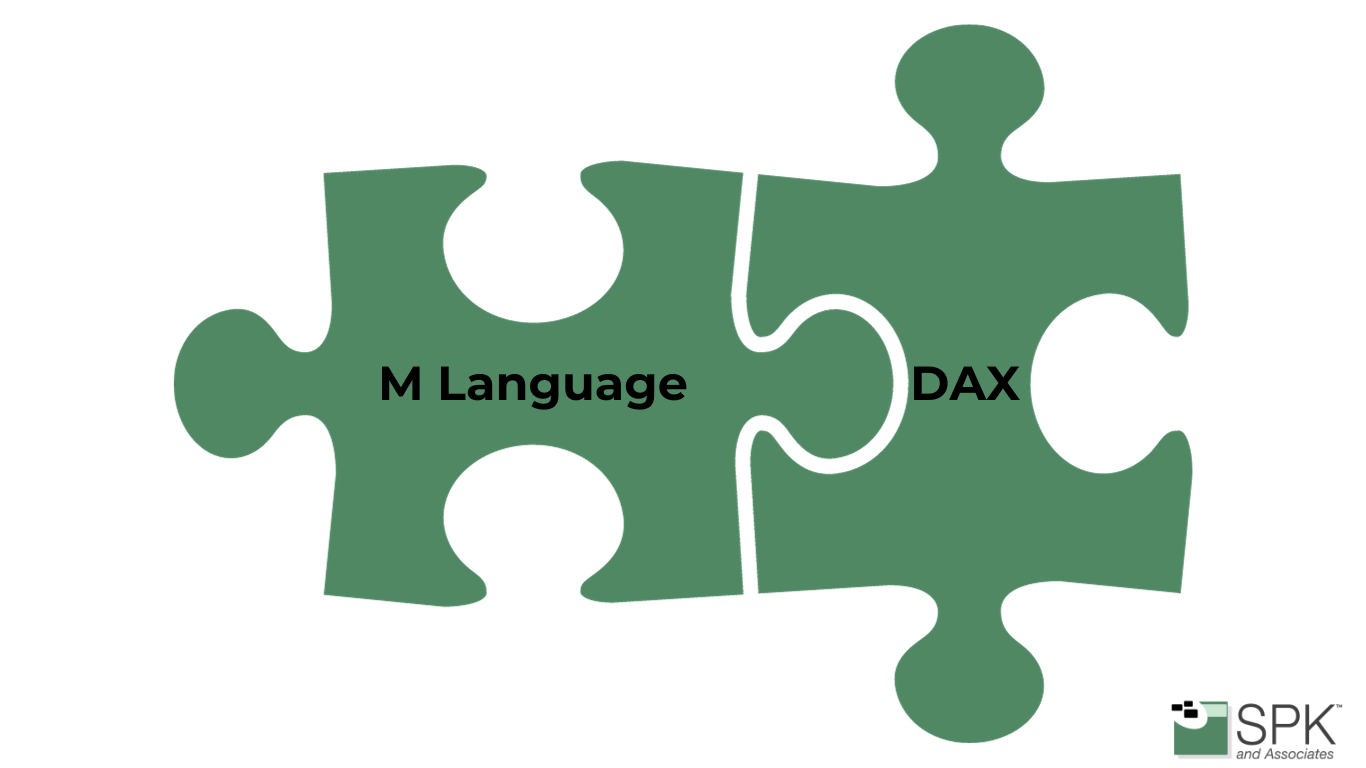
In real-world scenarios, they often work in synergy. For example, you might use M Language in Power Query for data cleansing. Next you might employ DAX in your model for advanced calculations and interactive reports. The interplay between these languages elevates your data game.
Why You Should Learn DAX
- Endless Possibilities: It opens the door to a world of dynamic data manipulation. It enables you to create calculated columns, measures, and tables that adapt to user interactions, significantly expanding your Power BI capabilities.
- Frustration-Free Reporting: With DAX, your dashboards no longer fall short of expectations. In fact, you can effortlessly convert “blank” values into meaningful data. This ensures a smoother user experience and reports that consistently deliver as intended. Who doesn’t want that?
- Optimized Dashboards: Proficiency in DAX enables you to create smarter calculated columns and measures, resulting in efficient data retrieval and visualization. Your dashboards will run seamlessly, making the most efficient use of available resources.
- Beyond Power BI: It’s a versatile tool applicable in various Microsoft products, including Analysis Services and Power Pivot for Excel. Moreover, its resemblance to Excel formulas means your expertise is transferable.
- Skill Elevation: Its intricate filter context system hones your data manipulation skills. The knowledge you gain can enhance your approach to data across different domains, transforming you into a more adept data professional.
Is Learning DAX Hard?
While it offers great potential, it does have a few initial considerations to be aware of:
- Steep Learning Curve: Mastering DAX demands time and effort, particularly in comprehending filter contexts and intricacies. Assess your frequency of use to determine if the investment is worthwhile.
- Alternatives Exist: In certain scenarios, alternative tools like Python can handle various data manipulations, potentially making DAX unnecessary. Assess your specific needs and the available tools.
- Clarity for Collaborators: Complex DAX calculations may perplex team members unfamiliar with the language. This consideration is especially important when collaborating on projects.
- The 80/20 Rule: For many users, 80% of their requirements can be met without extensive DAX. If your dashboards are relatively straightforward, outsourcing DAX tasks might be a more efficient option.
You can also work with a trusted training provider to improve your Power BI and DAX skills.
Take The First Steps
DAX is a powerful key to unlocking Power BI. Its versatility helps you to create dynamic reports and conduct insightful analyses. If you’re ready to improve your business reporting and need support to get started, our team at SPK can help.


